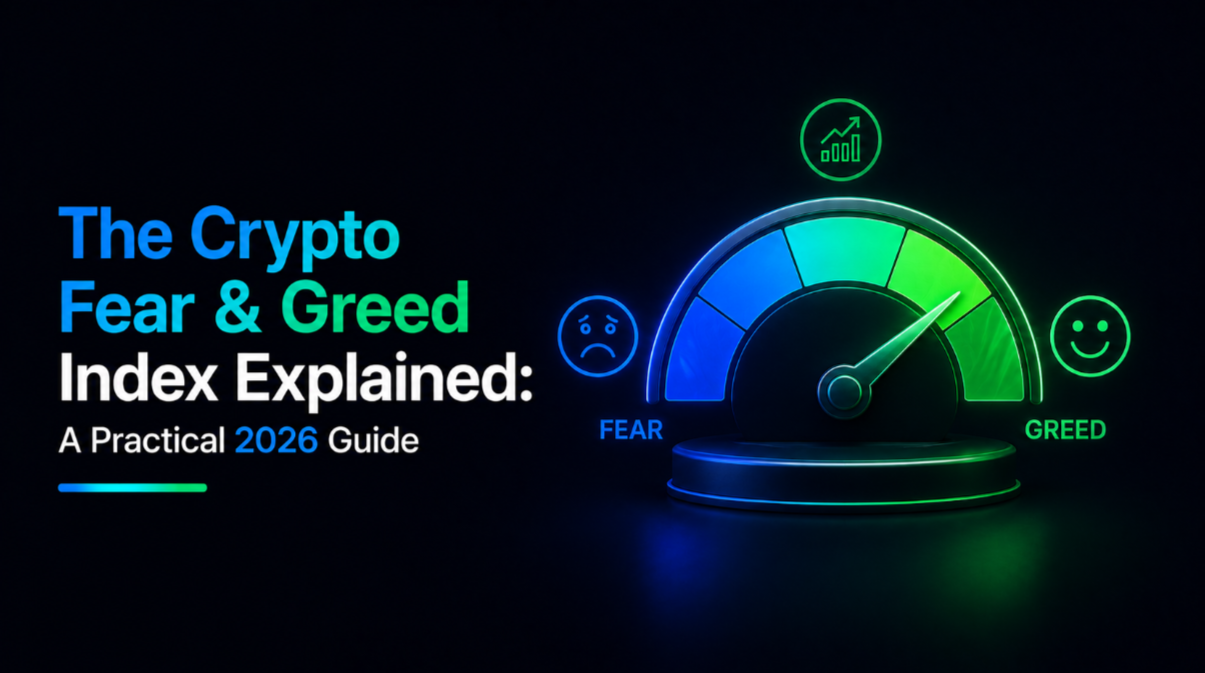
The Crypto Fear & Greed Index is one of the most-cited sentiment indicators in crypto. It compresses complex market conditions into a single 0-100 number, from extreme fear to extreme greed. Used well, it's a valuable contrarian signal. Used mechanically, it produces terrible trades. This guide covers how the index actually works, historical accuracy, and how sophisticated investors integrate it into their process.
The index at a glance
Standard interpretation:
- 0-25: Extreme fear. Historical rally candidate.
- 26-45: Fear. Cautious sentiment.
- 46-55: Neutral. Mixed sentiment.
- 56-74: Greed. Confidence building.
- 75-100: Extreme greed. Historical correction candidate.
The core insight: aggregate market sentiment tends to be wrong at extremes. Extreme fear implies most participants have already sold — hence little remaining selling pressure. Extreme greed implies most participants are already long — hence little remaining buying pressure.
How the index is calculated
Alternative.me's methodology (most-cited version):
- Volatility (25%): BTC volatility vs recent averages. High volatility often = fear.
- Market momentum / volume (25%): BTC price and volume vs 30/90-day averages. Weak momentum = fear.
- Social media sentiment (15%): Twitter/X sentiment analysis.
- Bitcoin dominance (10%): BTC market cap share. Rising dominance often = fear (money flows to safer BTC).
- Google Trends (10%): Search interest for negative crypto terms.
- Surveys (15%): Historical sentiment surveys.
Other index providers use different weightings and inputs. All are proxies; none measure sentiment directly.
Historical accuracy
At bottoms:
- The 2018 bottom coincided with extreme fear (index 8).
- The March 2020 COVID crash bottom hit index 8.
- The 2022 bottom (~$15.5k BTC) hit index 6.
- In all three cases, the index bottomed WEEKS after actual price bottoms.
At tops:
- The April 2021 top saw index at 84.
- The November 2021 top saw index at 82.
- The 2024 tops saw index in the 75-90 range.
- In all cases, extreme greed persisted for weeks before the actual top.
Pattern: the index is a lagging or coincident indicator, not a leading one. It confirms sentiment extremes but doesn't predict their reversals.
How to actually use it
As a check on your emotional state:
If the index is at extreme fear and you feel bullish, your instinct is contrarian to the herd — often correct. If the index is at extreme greed and you feel bullish, your instinct is aligned with the herd — potentially late.
As a DCA modulator:
A common approach: DCA at your standard weekly amount at neutral readings. Increase DCA by 25-50% during extreme fear. Reduce or pause DCA during extreme greed (with the reserved capital available for the next fear phase).
As a rebalancing trigger:
Some investors add rebalancing at index extremes. Sell some BTC into extreme greed to buy stablecoins; buy BTC with stablecoins during extreme fear. This creates mechanical contrarianism.
What NOT to do with the index
- Do not use it as a mechanical trigger. Index at 15 does not mean "buy tomorrow." It means "sentiment is bearish."
- Do not sell everything at extreme greed. Extreme greed can persist through significant additional gains before turning.
- Do not buy the first extreme fear reading. Extreme fear can extend for weeks or months at successive lower lows.
- Do not trust it during unusual macro events. The index is calibrated to crypto-native dynamics. External shocks (banking crises, geopolitical events) can produce readings that don't follow historical patterns.
Combining with other signals
The index is most useful when combined with other indicators:
- + Trend: extreme fear in a broader uptrend = strong buy signal. Extreme fear in a downtrend = potential continuation.
- + Volume: extreme fear with capitulation volume = potential bottom. Without capitulation volume = potentially more downside.
- + Cycle position: extreme greed late in a cycle (3+ years since last bear bottom) = seriously consider trimming. Extreme greed early in a cycle = probably early.
The Fear & Greed Index is a mirror, not an oracle. It tells you what the market is feeling now, which is often useful information about what it might do next — but not always. Combine it with structural analysis, and use it to check your own emotional state as much as to time markets.
Related: Crypto Market Cycles · Bull vs Bear Market · Technical Analysis for Beginners.