
US-listed spot Ethereum ETFs attracted approximately $820 million in net inflows during the week of April 7–11, 2026 — surpassing the $640 million that flowed into spot Bitcoin ETFs over the same period. It is the first time since spot ETH ETFs launched in July 2024 that institutional demand for Ether has outpaced demand for Bitcoin on a weekly basis. Analysts are debating whether this marks the start of a sustained rotation or a one-week anomaly.
How the ETF Race Reached This Milestone
When the SEC approved spot Bitcoin ETFs in January 2024, the products immediately drew record-setting inflows, partly because pent-up institutional demand had built over years of regulatory rejection. Bitcoin ETFs crossed $10 billion in cumulative AUM within weeks. ETH ETFs, approved six months later in July 2024, launched in a more muted environment: Bitcoin had already claimed the "digital gold" mindshare, and ETH lacked an equally simple narrative for institutional sales desks.
The first eight months of ETH ETF trading were characterised by modest, sometimes negative weekly flows. The picture began to shift in Q1 2026 as Pectra's activation date firmed up, ETH/BTC ratio discussions gained mainstream attention, and several asset managers upgraded their Ethereum outlooks. The flow reversal is the tangible result of that shift in institutional opinion.
Who Is Buying: Flows by Issuer
The week's inflow was not concentrated in a single product:
- BlackRock iShares Ethereum Trust (ETHA): $310 million in net inflows
- Fidelity Ethereum Fund (FETH): $195 million
- Grayscale Ethereum Mini Trust (ETH): $140 million
- Bitwise Ethereum ETF (ETHW): $92 million
- Other issuers combined: $83 million
BlackRock's dominance reflects its institutional distribution network, but the breadth across issuers suggests genuine category-level demand rather than a single large mandated trade. Grayscale's continued positive flow is notable given that its older, higher-fee ETHE product shed assets consistently after launch.
What Drove the Surge: Macro and Narrative Catalysts
Several converging factors accelerated ETH ETF demand in early April:
- Pectra activation confirmed: The final mainnet activation date was announced, giving institutional buyers a near-term catalyst with a concrete timeline.
- ETH/BTC discount at extremes: With the ratio near 5-year lows, systematic "value" allocators flagged Ethereum as statistically cheap relative to Bitcoin.
- Staking yield integration rumours: Reports that the SEC was reconsidering its objection to staking yield in spot ETH ETF structures circulated, raising the prospect of yield-bearing ETH ETF products that could attract pension mandates.
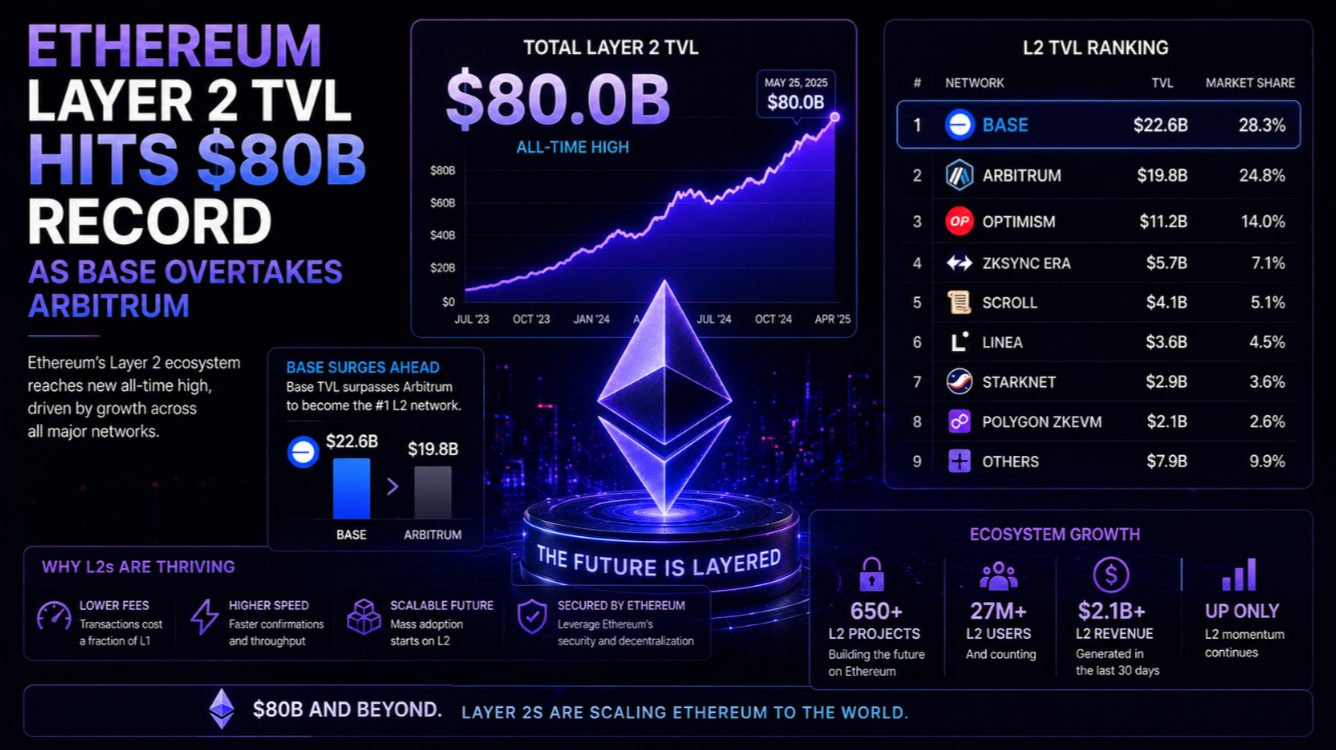
- Positive Q1 DeFi earnings: On-chain protocol revenue data for Q1 2026 showed record fee generation across Ethereum L2 ecosystems, validating the productivity narrative.
The Staking Yield Question: ETH ETF 2.0
Current spot ETH ETFs hold unstaked Ether and pay no yield. If the SEC greenlights staking within the ETF wrapper, issuers could offer a yield of 3–4 % annually — transforming ETH ETFs from pure price exposure vehicles into yield-generating instruments comparable to bond funds. This would open the product to an entirely different class of institutional buyer: income-oriented allocators currently excluded from non-yielding crypto.
Major issuers have all submitted amended S-1 filings that include staking language. The SEC has not objected in recent correspondence, a change from its earlier posture. Legal experts estimate a 60–70 % probability of staking-enabled ETH ETFs launching in 2026. If that happens, industry models project $30–50 billion in incremental inflows driven by income mandates. You can track ETH price implications on the Ethereum market page.
Implications for ETH Price and the ETH/BTC Ratio
The relationship between ETF flows and spot price is complex but directional. Bitcoin's experience shows that sustained ETF inflows compress the available supply of exchange-held coins, creating upward price pressure when demand remains consistent. ETH already has lower exchange reserves than Bitcoin relative to market cap, amplifying the supply squeeze dynamic.
For the ETH/BTC ratio specifically, a structural shift toward ETH ETF inflows matching or exceeding BTC flows would be the single most powerful catalyst for ratio recovery. Even 50 % parity in weekly flows over six months would represent a radical change from the 2024–2025 baseline. The Ethereum forecast covers price scenarios under various ETF flow assumptions.
Risks and Caveats
One week of outperformance does not constitute a trend. Bitcoin ETF flows have historically surged around macro events (FOMC decisions, halving anniversaries, regulatory news) and then reverted. The same dynamic could cause a mean reversion in ETH/BTC ETF flows if Bitcoin recaptures the narrative.
Additionally, staking yield integration remains uncertain. A negative SEC ruling would remove what many analysts consider the most powerful ETH ETF catalyst, potentially triggering a reversal of recent inflows. Investors should monitor weekly flow data closely and treat this milestone as a leading indicator rather than a confirmed regime change.