Most traders who try to "catch the next trend" in crypto do so reactively — they notice a sector going parabolic on social media and pile in near the top. Systematic trend-spotters do the opposite: they identify the conditions that precede a move, position while the crowd is still indifferent, and exit when the narrative hits mainstream Twitter. This guide walks through the analytical frameworks — on-chain data, developer activity, venture capital signals, macro context, and social dynamics — that give you a structured edge for spotting emerging crypto trends in 2026.
The frameworks apply across all market cap tiers, from Bitcoin and Ethereum macro moves to micro-cap sector rotations. You do not need to catch every trend — catching two or three a year with conviction sizing outperforms chasing every narrative.
Why most "next trend" calls fail
The failure mode is almost always the same: pattern recognition without process. Traders see that AI tokens, DePIN projects, or RWA platforms are pumping, then extrapolate indefinitely. By the time a narrative is visible to most market participants, it has often already priced in the easy gains. The structural reasons trend-calling fails:
- Hindsight bias — It is trivially easy to explain why a trend happened after it has occurred. Building a systematic framework before the fact is categorically harder.
- Signal-to-noise collapse — Crypto social media has an incentive structure that rewards amplification over accuracy. Most "alpha" on Twitter/X is recycled hype, not original research.
- Narrative lag — By the time a narrative appears in mainstream crypto media, you are reading about it two to four weeks after on-chain and VC signals first appeared.
- Survivorship bias — You see the narratives that worked (DeFi summer 2020, NFT 2021, L2 2023, AI tokens 2024). You do not see the dozens of narratives that were hyped and failed: gaming tokens, metaverse real estate, music NFTs, and so on.
- Confirmation seeking — Most research is conducted to validate a position already taken, not to falsify a hypothesis. Effective trend research must actively look for reasons a narrative will fail.
The antidote is a structured, repeatable process that collects multiple independent signals before forming a view. No single signal is sufficient. Conviction should be proportional to the number of independent frameworks pointing in the same direction.
The 4-year cycle and narrative rotation
Bitcoin's halving cycle creates a recurring macro backdrop that shapes which narratives gain traction in each phase. The cycle is not deterministic, but it provides a useful prior for where the market's attention and liquidity are likely to flow.
- Year 1 (post-halving accumulation, 2024): Institutional and early retail accumulation of BTC and ETH. Layer-1 infrastructure narratives are seeded. VC raises start clustering around a new sector. On-chain activity is low but developer activity is high. This is when trend research is most valuable — nobody cares yet.
- Year 2 (expansion, 2025): BTC moves to new ATHs. Liquidity rotates from BTC to ETH to large-caps. The infrastructure seeded in Year 1 launches mainnet. Early adopters of the Year 1 narrative see 5–20x returns. Narrative appears in mid-tier crypto media.
- Year 3 (peak and distribution, 2026): Retail FOMO drives the final leg. The narrative hits mainstream financial media. Late entrants buy the top. VC tokens unlock and create sell pressure. Smart money rotates back to BTC as a risk-off trade.
- Year 4 (bear market and reset): Leverage is washed out. Failed projects die. Genuine infrastructure survives and compounds. The next cycle's narrative begins forming in obscurity.
In 2026 (Year 3 of the current cycle), the highest-alpha plays are most likely found in narratives seeded by VC raises in 2024 that are just now launching mainnet, not in sectors that have already had a 10x run in 2025.
To calibrate your position in the cycle, track BTC dominance alongside total crypto market cap. When BTC dominance drops from a peak above 60% and total market cap is still rising, alt season is typically underway. See the Bitcoin market page for live dominance data.
On-chain leading indicators: TVL, fees, and active addresses
On-chain data is the closest thing crypto has to real economic activity. Unlike price, which can be manipulated by thin liquidity, genuine on-chain engagement is expensive to fake at scale. The three most predictive on-chain leading indicators:
- Total Value Locked (TVL) — TVL measures how much capital is deposited into a protocol's smart contracts. Rising TVL in a sector (DeFi, liquid staking, RWAs, perpetual DEXs) while prices are flat is a strong early signal: users are engaging before speculators arrive. Track absolute TVL and TVL growth rate. Sources: DefiLlama (cross-chain TVL), each chain's native analytics dashboard. Warning: TVL can be inflated by circular liquidity incentives (protocols paying emissions to attract deposits that will leave when incentives end).
- Protocol fees and revenue — A protocol generating real fee revenue from real users has product-market fit. DefiLlama's "Fees" dashboard tracks annualized revenue across hundreds of protocols. A project in an "emerging sector" that is generating top-50 fee revenue before the sector is widely known is a high-signal leading indicator. Uniswap, Lido, and Jito all showed fee growth weeks before their respective sector narratives went mainstream.
- Daily active addresses (DAA) — For layer-1 blockchains and layer-2 networks, DAA growth indicates genuine user adoption rather than speculative price action. Sustained 30-day growth in unique active addresses while price is flat or declining is a classic "smart money accumulation" signal. Monitor via Artemis, Token Terminal, Dune Analytics.
A practical framework: run a weekly scan of DefiLlama and Token Terminal. Sort protocols by 30-day TVL growth and 30-day fee growth. Any protocol showing 50%+ TVL growth and meaningful fee revenue that you cannot find in mainstream crypto media is worth deeper research. Cross-reference against the VC raise data (Section 5) and GitHub activity (Section 6).
Twitter/X and Farcaster: extracting signal from noise
Social media is simultaneously the noisiest and most real-time source of crypto narrative formation. The key is distinguishing between organic discourse from researchers and builders versus manufactured hype from paid promoters and influencers. Techniques for improving signal quality:
- Follow the researchers, not the promoters — A small set of independent analysts, protocol researchers, and on-chain data scientists produce original work. Their threads and posts often appear weeks before mainstream coverage. Curate a list of 20–40 high-signal accounts and filter ruthlessly. Key signal: do they cite specific on-chain data and code? Promoters never do.
- Track narrative velocity, not just volume — A term appearing in 50 tweets from builders in Week 1, 200 tweets in Week 2, and 2,000 in Week 3 is a stronger signal than 10,000 tweets in Week 1 (likely coordinated). Use the LunarCrush or Santiment social volume dashboards to track weekly growth rates for specific keywords.
- Farcaster as an early-signal channel — The Farcaster protocol (Warpcast client) has a higher proportion of actual developers and protocol contributors relative to speculative traders than Twitter/X. New protocol launches, audits, and governance proposals often appear on Farcaster one to two weeks before Twitter amplification. For technical crypto trend research, Farcaster is an underutilized alpha source in 2026.
- Sentiment divergence — When on-chain data (TVL, fees, DAA) is improving while social sentiment is neutral or negative (the market "doesn't care" about a sector), this divergence is one of the strongest early trend signals available. Conversely, when social sentiment is euphoric but on-chain data is flat or deteriorating, the narrative is likely overextended.
VC raise tracking: follow the smart money
Venture capital investment in crypto projects is a 12–24 month leading indicator of what narratives will reach retail markets. VC firms do deep technical and market diligence before committing capital; their sector allocations reflect informed bets on what will be valuable in the next cycle phase. Importantly, VC raises are public information — but most retail traders never look at them.
Primary sources for crypto VC raise data: CrunchBase, Messari Fundraising, The Block Research, CryptoRank.io, and individual fund announcement posts. Track raises at the sector level, not just individual projects. When three or more top-tier funds (a16z Crypto, Paradigm, Multicoin, Pantera, Sequoia, Dragonfly) all announce investments in the same sector within a six-month window, that sector is highly likely to become a major narrative in the following 12–18 months.
- 2024 VC sector clusters (predictive for 2026): AI-blockchain infrastructure (decentralized inference, on-chain AI agents), DePIN (decentralized physical infrastructure: compute, energy, mapping), RWA tokenization (T-bills, credit, real estate), modular blockchain stack (DA layers, ZK proving, restaking), and Bitcoin L2 infrastructure.
- Red flags in VC raise data: inflated round valuations relative to product stage; strategic rounds from the project's own ecosystem funds rather than independent VCs; rounds without named lead investors; raises that coincide with token listings (indicating insiders selling rather than building).
- Token unlock calendars: once you identify a VC-backed project in your target sector, check the token vesting schedule on TokenUnlocks.app or Vestlab. Large VC token unlocks (>10% of supply) within 3–6 months of your planned entry are a significant headwind regardless of narrative quality.
Developer activity: GitHub commits and Electric Capital data
Developer activity is the most durable signal for long-term sector health. Projects and ecosystems with growing developer counts are building the infrastructure that will attract users and capital in the next 12–24 months. Projects with declining developer counts are extracting from existing technology, not creating new value.
The Electric Capital Developer Report (published annually, with quarterly updates) is the gold standard for ecosystem-level developer counts. It tracks unique developers making monthly commits across all major blockchain ecosystems. Key findings from the 2025 report relevant to 2026:
- Ethereum retains the largest absolute developer count (~7,000 monthly active developers) and the most activity in L2, DeFi, and restaking infrastructure.
- Solana ecosystem developers grew 40% year-on-year in 2025, driven by consumer apps, DePIN, and payments.
- Bitcoin ecosystem development tripled from 2022 levels, concentrated in L2 protocols (Lightning, BitVM-based bridges, Ordinals infrastructure).
- AI-blockchain intersection projects attracted 1,200+ new developers in 2025 alone, the largest single-sector cohort since DeFi summer.
For project-level GitHub analysis, use the following approach: navigate to the project's GitHub organization, check the commit frequency graph (Insights tab) for the last 12 months, count unique contributors per month, and look at the ratio of core vs. peripheral commits. A healthy open-source project has 5–20 core contributors making near-daily commits plus a larger community of occasional contributors. A project with only 2–3 contributors and sporadic commit bursts is a red flag regardless of TVL or social engagement.
Tokenomics red and green flags
Even a genuine sector rotation into a real narrative can produce negative returns if the specific token you hold has broken tokenomics. The token structure is the mechanism that translates protocol success (TVL, fees, users) into holder value — or extracts value from holders to insiders.
Green flags in tokenomics design:
- Fee accrual to token holders — The protocol's real revenue flows to stakers or buyback mechanisms that reduce circulating supply. Examples: GMX (fees to GLP and GMX stakers), Jito (MEV tips to JitoSOL holders), Curve (vote-lock revenue sharing). This is the baseline for a token with fundamental valuation.
- Low team/VC allocation — Best-in-class projects allocate 15–20% combined to team and investors with 3–4 year vesting. Red zone: >30% combined to insiders with vesting under 2 years.
- Community/ecosystem allocation — A large, programmable community fund (40%+) that is governed by actual token holders rather than a foundation board aligns long-term incentives.
- Deflationary pressure mechanisms — Token burns, buybacks, or staking lockups that structurally reduce circulating supply in proportion to protocol usage create favorable supply-demand dynamics as adoption grows.
Red flags in tokenomics design:
- Imminent large unlocks — Check the unlock schedule on TokenUnlocks.app. A cliff unlock of 15%+ of supply within 6 months of your entry is a structural sell pressure event regardless of narrative.
- Perpetual emissions with no sink — Protocols that pay high APY entirely through token inflation without a mechanism to absorb or burn tokens are running a Ponzi dynamic — early stakers are paid by diluting later entrants.
- Opaque treasury — If the team cannot show where the treasury funds are held and how they are deployed, do not trust the project's longevity claims. DeepDAO and OpenOrgs track DAO treasuries; projects that are not reporting transparently are a red flag.
- Governance theater — Token governance is valuable only if the team cannot unilaterally override governance votes. Review whether the multisig signers are independent parties or all controlled by the founding team.
Macro and liquidity drivers for crypto trends
Crypto does not exist in a macro vacuum. Global liquidity conditions, interest rate cycles, and USD strength are among the most powerful external forces shaping when crypto trends can sustain multi-month price appreciation versus when even genuine narratives get sold.
- Global M2 and credit impulse — Crypto bull markets have historically coincided with periods of global M2 expansion (central banks in the US, EU, China, and Japan all in easing mode simultaneously). Cross-asset analyst Michael Howell's Global Liquidity Index is tracked widely in crypto macro circles. When global M2 growth is positive year-over-year, narrative-driven altcoin rallies tend to sustain. When M2 is contracting, narratives stall even if the fundamental data is strong.
- US Federal Reserve posture — Fed rate cuts increase risk appetite and reduce the opportunity cost of holding non-yielding or volatile assets. The 2025 rate cut cycle was a primary macro catalyst for the 2025–2026 alt season. Fed expectations are priced into CME FedWatch futures; track the implied terminal rate monthly.
- DXY (US Dollar Index) — Crypto prices are primarily denominated in USD. A weakening DXY (USD losing value against major currencies) historically correlates with crypto outperformance. Track DXY trend alongside BTC/ETH price to identify divergences.
- Stablecoin supply growth — Total stablecoin market cap (USDT + USDC + others) is a proxy for "dry powder" — capital sitting in crypto markets waiting to be deployed. Rising stablecoin supply while prices are flat indicates accumulation. Stablecoin supply that is flowing onto exchanges (on-chain data: net stablecoin exchange inflows) signals imminent buying pressure.
For a practical macro dashboard, track: Global M2 growth rate, CME FedWatch terminal rate expectations, DXY weekly close, total stablecoin market cap, and BTC exchange outflows (BTC leaving exchanges signals long-term holding, not selling). The Ethereum market page includes live market cap data that can be cross-referenced against these macro inputs.
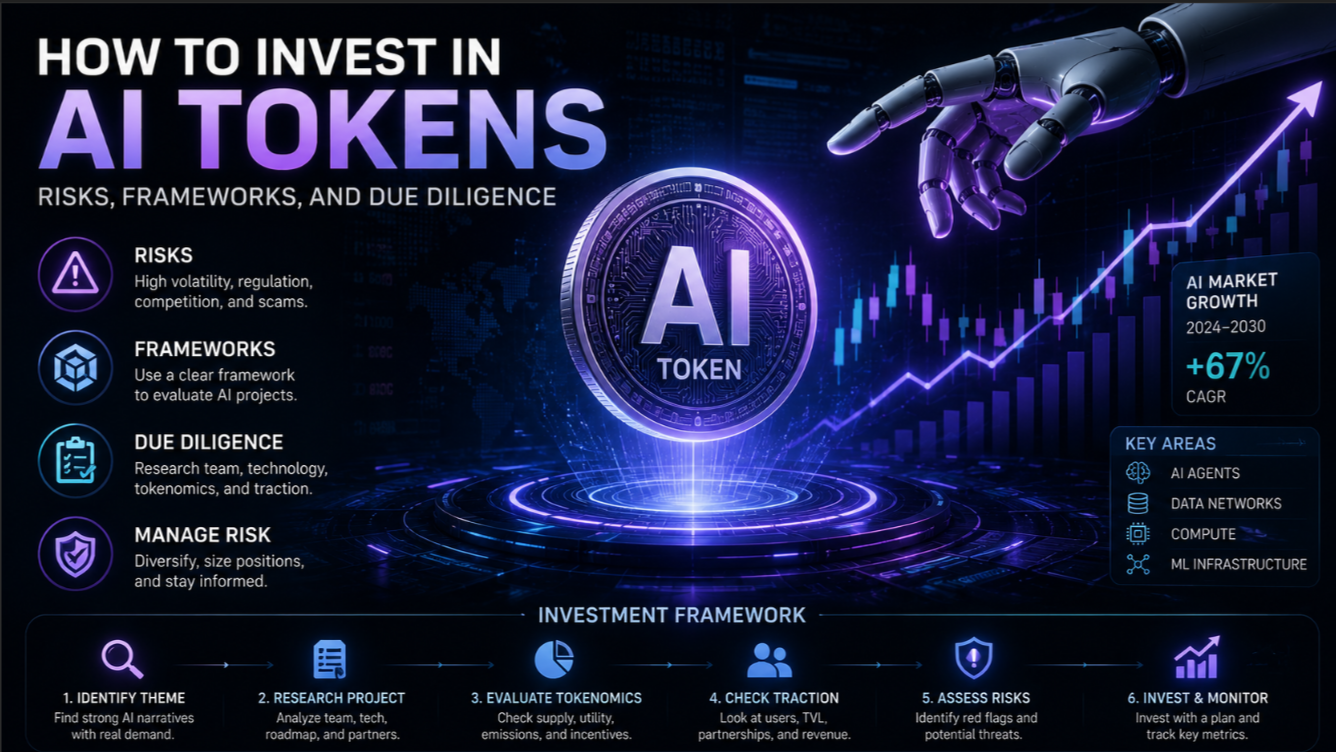
Sector rotation patterns: AI to DePIN to RWA to memecoin
Within a single crypto bull market cycle, capital does not flow uniformly into all sectors simultaneously. It rotates — typically from lower-risk infrastructure plays (BTC → ETH → large-cap L1s) to higher-risk narrative sectors in a predictable sequence driven by capital looking for marginal returns.
The 2024–2026 cycle rotation pattern provides a concrete case study:
- BTC / ETH (2023–Q1 2024): ETF approvals and institutional flows dominated. Risk-averse capital entered crypto via the most liquid, most regulated instruments.
- AI + blockchain infrastructure (Q2–Q4 2024): VC funding for AI-blockchain crossovers drove early narrative formation. Tokens like TAO (Bittensor), RNDR (Render), FET (Fetch.ai) showed strong relative performance. Developer activity in the sector accelerated.
- DePIN (Q1–Q2 2025): Decentralized Physical Infrastructure Networks — Helium, Hivemapper, Grass, Akash — attracted attention as the "real-world utility" narrative. Protocol revenues were modest but growth rates were high.
- RWA (Real-World Assets) (Q2–Q3 2025): Tokenized T-bills, credit protocols (Centrifuge, Maple Finance), and real estate platforms attracted institutional capital seeking yield. ONDO, CELO RWA frameworks, and BlackRock's BUIDL fund brought mainstream legitimacy.
- Memecoin season (Q4 2025–Q1 2026): Retail capital flows from narratives with real use cases into pure speculative momentum plays. Memecoins typically peak late cycle — high volatility, short duration, no fundamental thesis.
The implication for 2026 research: identify which sectors are early in their rotation cycle (high developer activity, VC backing from 2024, on-chain metrics growing but not yet in mainstream media) and which have already peaked (dominating social media, retail entering, tokenomics deteriorating from emissions). In 2026, the leading edge candidates are Bitcoin L2 infrastructure, ZK-native applications, and AI agent protocols that are still pre-mainstream.
Building a personal trend dashboard
The frameworks above are most powerful when combined into a systematic weekly research routine rather than used episodically when you "feel" like something is moving. A practical personal dashboard requires a set of tools, a fixed scanning frequency, and a framework for scoring signal strength.
Recommended tool stack:
- DefiLlama — TVL, fees, revenue across all chains. Weekly: sort by 30-day TVL % growth and 30-day fee growth. Anything in the top 20 that you cannot explain is worth researching.
- Token Terminal — Protocol fundamentals: revenue, P/S ratio, DAU. Identifies which protocols have genuine economic activity vs. inflated TVL.
- Artemis — Cross-chain active address and transaction data. Best for comparing ecosystem-level user adoption across L1s and L2s.
- CryptoRank / Messari Fundraising — VC raise tracking by sector and date. Set a filter for raises above $5M from the last 12 months. Review sector clustering monthly.
- TokenUnlocks.app — Token vesting schedules. Before entering any position in a VC-backed token, check unlock schedule and cliff dates.
- Electric Capital Developer Report — Annual ecosystem developer counts. Use as a baseline for evaluating ecosystem trajectory.
- Santiment / LunarCrush — Social sentiment and volume metrics. Use for measuring narrative velocity, not as a primary signal.
- CME FedWatch — Macro: implied rate expectations. Check monthly alongside DXY and total stablecoin supply.
Weekly scanning process (suggested):
- DefiLlama: flag any protocol with 50%+ 30-day TVL growth and meaningful fee revenue not yet in mainstream media. Add to watch list.
- CryptoRank: check VC raises from the past 30 days. Identify sector themes. Flag any project with a top-tier lead investor in a sector you are not yet tracking.
- GitHub: for any new protocol on your watch list, check commit frequency and contributor count. Filter out projects with <3 active contributors.
- Twitter/X + Farcaster: search for the sector keyword, sort by "Latest," look for discourse from researchers and builders rather than price promoters.
- Macro check: DXY direction, total stablecoin supply trend, BTC exchange balance trend.
- Scoring: assign a 1–5 score to each watch list item across five dimensions: on-chain data, VC backing, developer activity, social momentum, macro alignment. Only investigate deeply items scoring 3+ across all five.
For platforms that help organize and filter exchange and service options before deploying capital into a new sector, see the exchange ratings and beginners crypto guide for foundational context. Understanding crypto charts is also essential before executing any trend-based trade.
Avoiding FOMO mistakes: discipline in trend research
The final and arguably most important framework is the one governing your own decision-making psychology. All the on-chain dashboards and VC tracking in the world are useless if you override your process when a narrative hits social media and you see green candles.
- Pre-commit your research process before prices move — The correct time to analyze a sector is when it is boring, not when it is pumping. If you find yourself researching a token after it has already 3x'd in a week, you are researching the narrative for FOMO justification, not for investment thesis formation.
- Position sizing proportional to conviction, not momentum — Momentum-based sizing (increasing position size as price rises because "it's working") is the primary mechanism by which retail investors buy tops. Size based on your pre-entry thesis quality: how many independent signals point in the same direction? How strong is the fundamental data?
- Invalidation criteria before entry — Write down what would make your thesis wrong before you buy. Specific, falsifiable criteria: "If TVL growth reverses for two consecutive weeks," or "If the lead developer leaves the project," or "If the VC that led the raise sells its full allocation." Without a pre-defined exit, you will hold through the narrative deterioration.
- Narrative vs. token performance divergence — Sometimes the narrative is real but the token underperforms because of tokenomics (large unlocks, emissions, no fee accrual). Ethereum L2 adoption in 2024 was real; ETH underperformed competing L1s for much of the year because the revenue was not accruing to ETH holders. Track whether the token mechanism actually captures value from the narrative's success.
- Rotation and exit discipline — Trends end. In crypto, they often end abruptly when the narrative reaches mainstream financial media (Bloomberg, CNBC segments on a specific sector), when VC token unlocks begin, or when on-chain metrics peak. Build your exit criteria into your dashboard. Waiting for a 20% decline from the high before reconsidering is not a process — it is hope.
The edge in crypto trend-spotting is not faster access to information — everyone has the same DefiLlama and Twitter feed. The edge is systematic processing: running the same analytical framework every week, being early to the research before you are early to the trade, and maintaining exit discipline when the narrative peaks.
Trend identification in crypto is a skill that improves with deliberate practice. The frameworks in this guide — cycle positioning, on-chain leading indicators, VC tracking, developer activity analysis, tokenomics review, macro context, and sector rotation — are individually available to any researcher with an internet connection. The compound advantage comes from integrating all of them into a consistent weekly process and having the discipline to act on early signals and exit at narrative peak rather than market peak.